The Biological Overview Effect: Our Place in Nature
| Correspondence | Charles H. Lineweaver, charley.lineweaver@anu.edu.au; Aditya Chopra, aditya.chopra@anu.edu.au Citation | Lineweaver, C. H. and A. Chopra. (2019) The Biological Overview Effect: Our Place in Nature. Journal of Big History, III(3); 29 - 53. DOI https://doi.org/10.22339/jbh.v3i3.3360 |
Abstract
While gazing at the Earth from orbit, some astronauts have described a cognitive shift known as the overview effect. Here we describe an analogous biological overview effect produced by looking at the tiny twig of humanity on the tree of life. We describe the increasingly precise phylogenetic tree of all life on Earth and how it shows us our place in nature. We discuss problems with this tree including the assumption of sexual isolation, purely vertical gene transmission and the dependence of LUCA (Last Universal Common Ancestor) on the completeness of the tree. We compile and present the most concise taxonomic overview of the evolution of our lineage from Archaea to humans.
| Overview Effects The overview effect is a cognitive shift in awareness reported by some astronauts during spaceflight, often while viewing the Earth from outer space. It is the experience of seeing firsthand the reality of the Earth in space, which is immediately understood to be a tiny, fragile ball of life, “hanging in the void”, shielded and nourished by a paper-thin atmosphere. From space, national boundaries vanish, the conflicts that divide people become less important, and the need to create a planetary society with the united will to protect this “pale blue dot” becomes both obvious and imperative. (O’Neill 2008) |
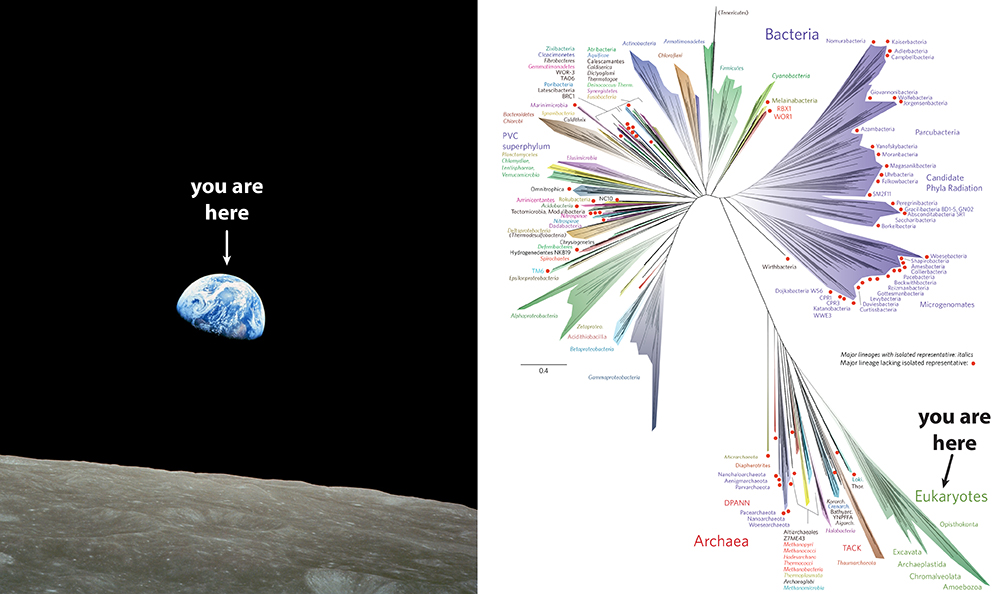 |
| Figure 1. Comparison of Overview Effects. Left: the astronomical overview effect evoked by “Earthrise” taken on 24 December 1968 by astronaut William Anders during Apollo 8. This was the first time humans travelled beyond low Earth orbit and saw their own home planet rising above the horizon of the Moon. Right: the biological overview effect evoked by a new more comprehensive tree of life including metagenomic sampling (Hug et al. 2016). The pale green sliver in the lower right corner is our genetic home and encompasses all eukaryotes. (Please click here for higher resolution jpg.) |
Broadly speaking, the overview effect is a new larger perspective that shifts our ideas of where we think we are (White 2014, 2019). The effect can be induced by the awe-inspiring vista from a mountain top, or by mind-broadening experiences in foreign lands. It can come when a peasant farmer visits Paris for the first time, or when a renaissance explorer peruses a new, more comprehensive map of the world. The overview effect involves a new perspective that turns fanciful labels for the unknown (“here be dragons”, “terra nullius”, “sphere of the gods”) into meaningful labels, and for the first time, embeds these regions into the rest of the known world or universe.
The overview effect can be personal and private, or it can be the transformation of an entire culture’s weltanschauung. Seeing the Earth from orbit transformed astronauts (e.g. White 2014). Images such as Apollo 8’s “Earthrise” and Sagan’s “Pale Blue Dot” have helped transform a civilization (Brand 1968, Sagan 1994).
The Spatial Overview EffectThe original spatial overview effect of astronauts is a re-conceptualization of where we are, based on new spatial or astronomical information about the space around us. A spatial or astronomical overview effect comes from understanding the size of the universe and our place in it. One hundred years ago the size of the known universe was thousands of light years. Now it is billions of light years – an increase of about six orders of magnitude.
Figure 2 gives us a feeling for the enormous size of the universe compared to our tiny home planet. The comparison makes our bodies, homes, countries, planet, Solar System and even our Milky Way galaxy seem small and insignificant. Everything that was previously unimaginably large, becomes unimaginably small. We become more anonymous, trivial and humble – and we haven’t even broached the topic of the multiverse.
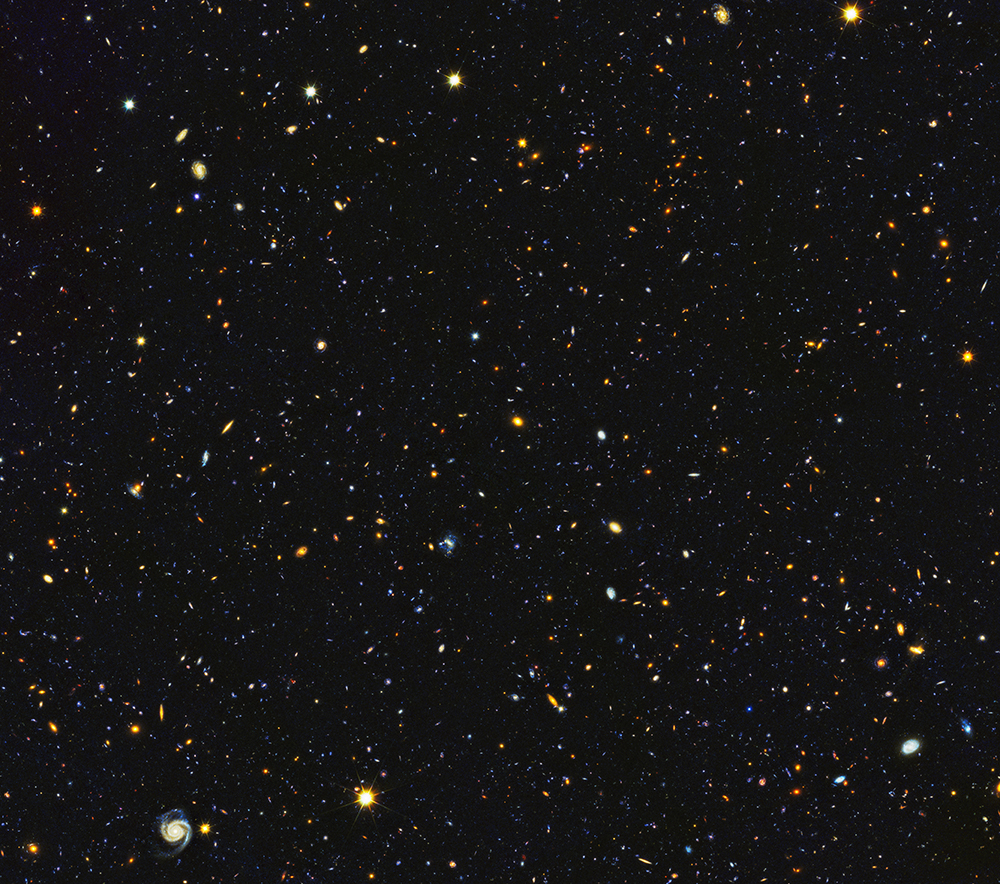 |
| Figure 2. Hubble Space Telescope image of a patch of sky about the size of a sheet of paper seen from 100 meters away. The ~15,000 galaxies in this image are millions and billions of light years away. A dozen stars from our galaxy are in the foreground. All the other points of light are other galaxies – each having hundreds of billions of stars. Hubble Deep UV (HDUV) Legacy Survey (Oesch et al. 2018). (Please click here for higher resolution jpg.) |
We can make images of the universe and map the space around us to distances of billions of light years. The ability to produce such images and to understand how small we are is an achievement that few species can boast about. Apollo, Voyager, astronomy, cartography, GPS and Google Maps offer us a broader and richer spatial map of where we are. However, overview effects are not limited to a spatial re-conceptualization of where we are. They can be categorized into three classes: spatial, temporal and biological. All of these overview effects contribute to big history: the attempt to understand the integrated history of the cosmos, Earth, life and humanity (Rodrigue et al. 2017, Christian 2004, 2018). The combination of modern geology, paleontology, biology, primatology and anthropology gives us a broader picture of where we have come from, how we got here, who we are – and maybe even where we are going and why?
Kuhn (1962) has coined the term “paradigm shift” to describe a re-conceptualization intrinsic to scientific revolutions: Copernican, Darwinian, Einsteinian and Quantum Mechanical. The overview effect involves a rapid paradigm shift, in which previous ideas and fundamental assumptions are undermined, rejected, and replaced by a larger, more accurate perspective. For astronauts, the Earth was no longer a map divided into different coloured nations. Warring religions, ideologies and economic doctrines cannot be seen from space. The Earth is a blue marble hanging in the black void. This new bigger picture challenges our identity and offers us a better answer to the question: What is our place in nature?
The Temporal Overview EffectThe temporal overview effect is a re-conceptualization of when we are, based on new temporal information such as: the universe is ~13.8 billion years old; Earth is ~4.5 billion years old; life on Earth is about 4 billion years old; and our species, Homo sapiens, is about 100,000 years old, or 2 million years old – depending on how one defines our species.
Big history is arguably best presented as a series of events viewed through the lenses of different sciences as one progresses chronologically from the Big Bang (cosmology) to the formation of the Sun and Earth (astronomy, planetary science, earth science), to the origin and evolution of life (biochemistry, microbiology and evolutionary biology), to the evolution of humans (archaeology, anthropology, history). For example, in Christian (2004), the sections are listed chronologically, starting with the Big Bang; “the inanimate universe”, then “life on Earth”, “early human history”, “the Holocene”, “modern era” and finally “future”. Christian (2018) also has chronologically arranged sections beginning with the ancient “cosmos”, then the more recent “biosphere”, and finally the most recent “us”.
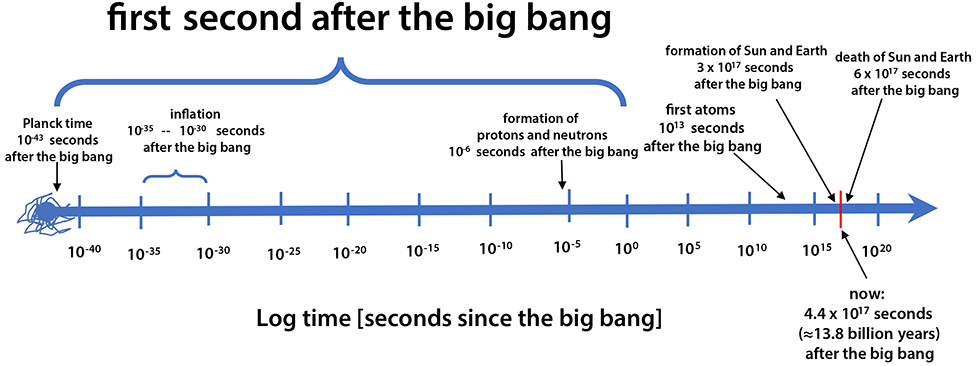 |
| Figure 3. The first second after the Big Bang. The cosmological clock ticks logarithmically. The biological clock probably also ticks logarithmically. For example, the earliest events of embryogenesis are paramount; “It is not birth, marriage or death, but gastrulation which is truly the most important time in your life” (Wolpert 1991). The heat death of the universe is off the plot to the right at ~ 10207 seconds after the Big Bang (Lineweaver & Egan 2007, Adams & Laughlin 1997) (Please click here for higher resolution jpg.) |
Logarithmic scales of space and time are often used to encompass and understand processes that have a large dynamic range (e.g. Adams & Laughlin 1997, 1999). For cosmologists interested in the origin and evolution of the universe, the cosmological clock ticks logarithmically (Figure 3 above). Every order of magnitude of time is examined for important events. Starting at the highest energy and earliest time possible (the Planck time 10-43 seconds after the Big Bang), the interval 10-43 of a second to 10-42 of a second is studied. Then the interval 10-42 of a second to 10-41 of a second is examined, etc. Equal attention is given to each such interval. The particle physicist Rocky Kolb (2006) explains:
| In this presentation, I will describe events that occurred in the first second of the life of the universe. There have been approximately four-hundred-thousand-million-million seconds since the beginning of the universe, so to concentrate on only one of them might seem the ultimate degree of overspecialization. But the very first second was really something special. |
The Biological Overview Effect
The biological overview effect is a cognitive shift in identity that occurs while viewing the phylogenetic tree of all life on Earth. It is the experience of recognizing how small our tiny human twig is among the vast genetic diversity of life. Our twig on the tree of life can be seen as just another species, hanging in the phylogenetic void. Our human twig is unique, just like the twig of every other species.
A large part of big history is the integrated history of life. Figure 4 is the best current map of our integrated biological history. The tree of life is constructed from the conserved and recognizably related sequences of DNA base pairs inside almost every cell of extant organisms. Our biological identity can be read from the hierarchy of taxonomic divergences in which we are embedded, along with every other living organism (Figure 4 and Table 1).
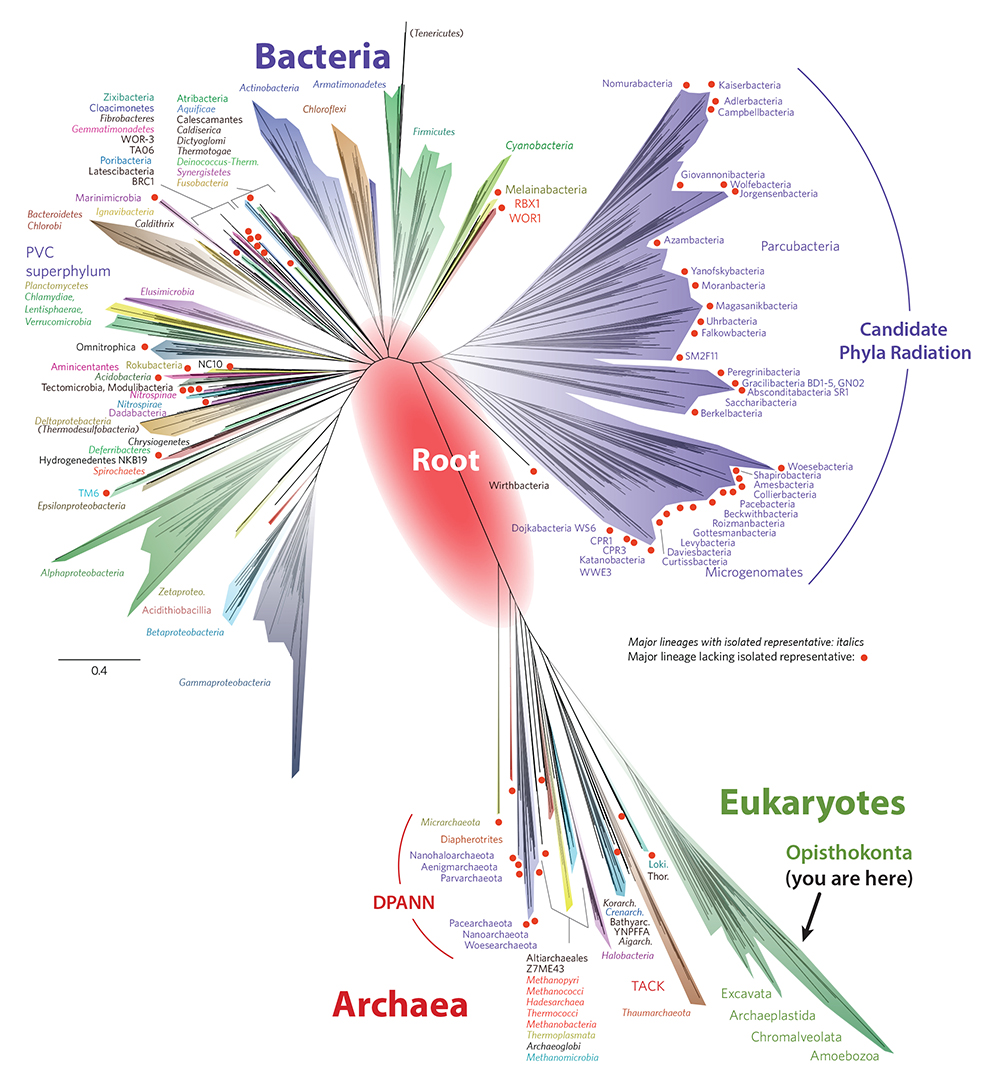 |
| Figure 4. The tree of life (modified from Hug et al. 2016). The diversity of all eukaryotes is represented by the green sliver in the lower right. On the right side of the green sliver, the small branch labelled “Opisthokonta” encompasses all animals and fungi (see node 35 of Table 1). The twigs with red dots are organisms that have been identified with metagenomics and have not been cultured. Whether through cultures or metagenomics, the microbial diversity on Earth is still far from complete. Also, viruses are not shown. The red oval in the center is an estimate of where the root of the tree lies. The “root” is another name for LUCA (Last Universal Common Ancestor). The large purple group in the upper right is the new “Candidate Phyla Radiation” (CPR). In the archaeal lower half of the tree, the very early branching organisms (closest to the red oval in the middle) have also been only metagenomically identified and therefore have a red dot at the end of their branches. Notice that most of the organisms with branches that emerge from the red oval are Candidate Phyla Radiation (CPR), DPANN and/or have red dots. (Please click here for higher resolution jpg.) |
Only the twigs of the tree of life are alive. The branches holding up the twigs represent the past lives of millions of ancestors and cousins. Our branch has grown as the bodies of our dead ancestors have piled up chronologically. The tree of life is principally arranged using the chemical fossils of conserved genomes in all extant life forms. The tree has been put together from the chemical footprints that our parents and earlier ancestors left inside us.
Here and there, the tree has been calibrated by the petrified remains of fossilized distant cousins. Since the vast majority of species that have ever lived have gone extinct, dead fossilized individuals with no extant descendants vastly out-number the dead individuals who are our ancestors. Thus, when we find a fossil who looks remarkably like what we imagine our ancestors to have looked like, it is usually a dead distant cousin, not a great-great-great-great-… -grandparent (Dawkins & Wong 2016, Fournier et al. 2009).
In this tree of life, ours is a small voice in a chorus of hundreds of millions of voices. We often think we are the soloist, but in the tree of all life, we are a small new voice in an ancient choir of prokaryotes. New landscapes of biological diversity show us our little lonely eukaryotic valley. In the most recent phylogenetic trees, our peripheral twig reminds us of Sagan’s pale blue dot (Sagan 1994). Ours is a tiny trivial twig amongst the enormous diversity of life. This new, comprehensive genetic landscape gives us an overview of biology – how we relate to other species – how we shared ancestors with mushrooms for ~3 billion years and only in the last ~1.1 billion years diverged from them. Like astronauts recognizing the common humanity of all people, this new deeper genealogy has us welcoming new members to our family. Now we can talk about “our close cousins the mushrooms”.
Our position in the lower right of Figure 4 can be described by paraphrasing Sagan’s description of our pale blue dot (Sagan, 1994 – excerpt in Planetary Society, 2019)
|
Look again at this pale green sliver. That’s home. That’s us. Within its genetic boundaries every organism you have ever seen, every vertebrate you have ever loved, lived out their lives. The aggregate of our breaths, heartbeats, and sexual desires, every human and non-human eukaryote, every playful puppy and petunia, every meerkat and mite, every mammal, reptile, amphibian and fish, every mushroom and mayfly, every dandelion and dragonfly, every blade of grass and every innocent wasp larvae eating its way out of a caterpillar, every parrot and paramecium, every oak tree and antelope, every kookaburra and cuttlefish, every deuterostome and protostome, every ant and anteater, every poisonous snake and harmless tadpole, every orca and ostrich, every salamander and sardine, every top predator and bottom feeder, every amoeba and armadillo, every loving octopus mother guarding her eggs and every predator trying to eat them, every dinosaur and dinoflagellate, and every tree fern and trilobite, every elephant and eel, every jawed fish and every jawless fish, and every life form with a rib or a jaw or a brain, every vertebrate and invertebrate in the history of eukaryotes lived there – in a pale green genetic sliver that emerged ~3 billion years ago from a small branch of the Archaea.
Eukaryotes are a very small genetic afterthought on the giant prokaryotic stage. Think of the rivers of blood and cytoplasm spilled by all those predators and parasites so that in glory and triumph they could become the momentary masters of a eukaryotic corpse. Our posturings, our imagined self-importance, the delusion that we have some privileged position in the genetic universe, are challenged by this trivial triangle. Our eukaryotic domain is a pale green sliver among the huge genetic diversity of life on Earth. The extent of our genetic diversity will fade even further if we can compare it to the diversity of life that may exist elsewhere. In the great enveloping genetic unknown – in our obscure sexually-isolated eukaryotic corner, among enormous diversity, there is no hint that help will come from elsewhere to save us from our swollen brains and multicellular megalomania. There is perhaps no better demonstration of the folly of human conceits than this green sliver of genetic space. To us, it underscores our responsibility to deal more kindly with other species, to preserve and cherish the diversity of life – the only life we’ve ever known. |
The branches in Figure 4 show the extent of genetic diversity. We have inserted the large red oval to indicate the most likely position of the root. As we follow the eukaryotic branch back in time, we rendezvous with the Asgard group (represented in Figure 4 by Lokiarchaeota (“Loki.”) and Thorarchaeota (“Thor.”) and then with the TACK group and then with DPANN and the rest of the Archaea (see nodes 42-45 and caption of Table 1). Notice that most of the basal or shortest branched Archaean lineages are in DPANN and have a red metagenomic dot at their tips. They have not been cultured.
If we want to know about the origin of life, and more specifically about the metabolism of the last universal common ancestor (LUCA) of all known life, we need to make sure we can identify where LUCA is. LUCA is located where the two deepest branches merge into one branch, but there is some ambiguity about which two those are. Hence, the relatively large size of the red oval. LUCA is sometimes called the root of the tree of life, but “trunk” is a better word. LUCA (or the root of the tree) should not be confused with the origin of life which precedes LUCA by some significant amount – perhaps by a few hundred million years.
As we find shorter branches in the tree of life such as the Candidate Phyla Radiation (CPR) and DPANN, estimates for the time of LUCA become earlier and come closer to the time of the origin of all life. This is shown in Figure 5 as “LUCA” (in small font higher up in the tree) becomes “LUCA” (in larger font lower in the tree) after the inclusion of CPR and DPANN.
Hierarchy of Taxonomic Divergences Along Our LineageInspired by Dawkins & Wong (2016) to get a better overview of our evolutionary identities, in Table 1 we have compiled the most concise taxonomic overview of the evolution of our lineage. The divergences seen in phylogenetic trees (e.g. Figure 4) become convergences or rendezvous when we imagine travelling backwards in time along our lineage. In Table 1, the numbers in the first column are rendezvous numbers (also known as phylostratigraphic nodes, cf. Domazet-Lošo & Tautz 2010, Trigos et al. 2017). These rendezvous are when our closest relatives merge with us at the time of the common ancestor. We start our voyage backward in time at node 1, 6.5 million years ago where we meet our most recent common ancestor with chimpanzees. At node 12, 96 million years ago we meet our common ancestor with dogs and cats. At node 40, about 2 billion years ago we meet our common ancestor with apple trees and bananas.
Numbers (1 – 37) in the first column are the rendezvous numbers from Dawkins and Wong (2016) with the name of the new group that is joining our lineage at each rendezvous in the second column. The third column is the name of our lineage before being joined by the group in the second column. The fourth column is the name of our group after being joined by the group in the second column. Notice that there is redundancy in that the name in the fourth column in rendezvous N, is the same as the name in the third column for rendezvous N+1.
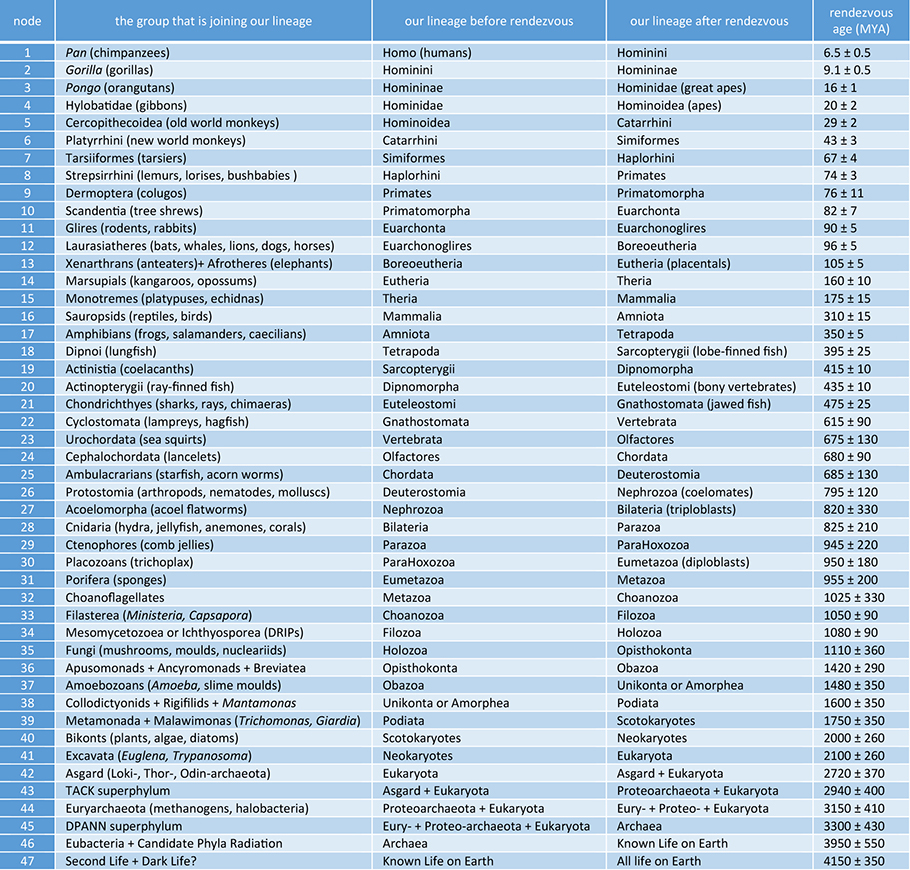 |
| Table 1. Hierarchy of Taxonomic Convergences Along Our Lineage (rendezvous with sister taxa)* *Names in parentheses are common names. Estimated dates for nodes 1- 40 are from Kumar et al. (2017). Dates for nodes 41-47 are from Betts et al. (2018). Kumar et al. (2017) do not have the same branching order and dates for some rendezvous points listed in Table 1. Thus, the dates for nodes 24, 29-31, 33-34, 37-40 are our estimates based on the catalogued divergence dates associated with the closest lineages described by Kumar et al. (2017). Uncertainties on rendezvous ages for nodes 1-40 are our estimates that account for the upper and lower range of divergence dates catalogued by Kumar et al. (2017). Uncertainties on rendezvous ages for nodes 41-46 are estimates reported by Betts et al. (2018). Some estimated dates reported in the table have been rounded to the nearest five Myr (nodes 14-32) or nearest ten Myr (nodes 32-47). We used the age of the Moon-forming impact ~4.5 Gyr (Stevenson & Halliday 2014) and the date associated with the putative earliest evidence for life on Earth ~3.8 Gya (Dodd et al. 2017, Nutman et al. 2016) to set the uncertainty associated with node 47. Branching orders and group names for lineages joining at: nodes 1-31 are based on Kumar et al. (2017); nodes 32-41 are based on Cavalier-Smith et al. (2014) and Shalchian-Tabriz et al. (2008); nodes 42-47 are based on Betts et al. (2018). TACK superphylum (Node 43) consists of Thaum-, Aig-, Cren- and Kor-archaeota. DPANN superphylum (Node 45) consists of Diapherotrites, Micr-, Parv-, Aenigm-, Nano-, Nanohalo-, Woese- and Pace-archaeota. (Please click here for higher resolution jpg.) |
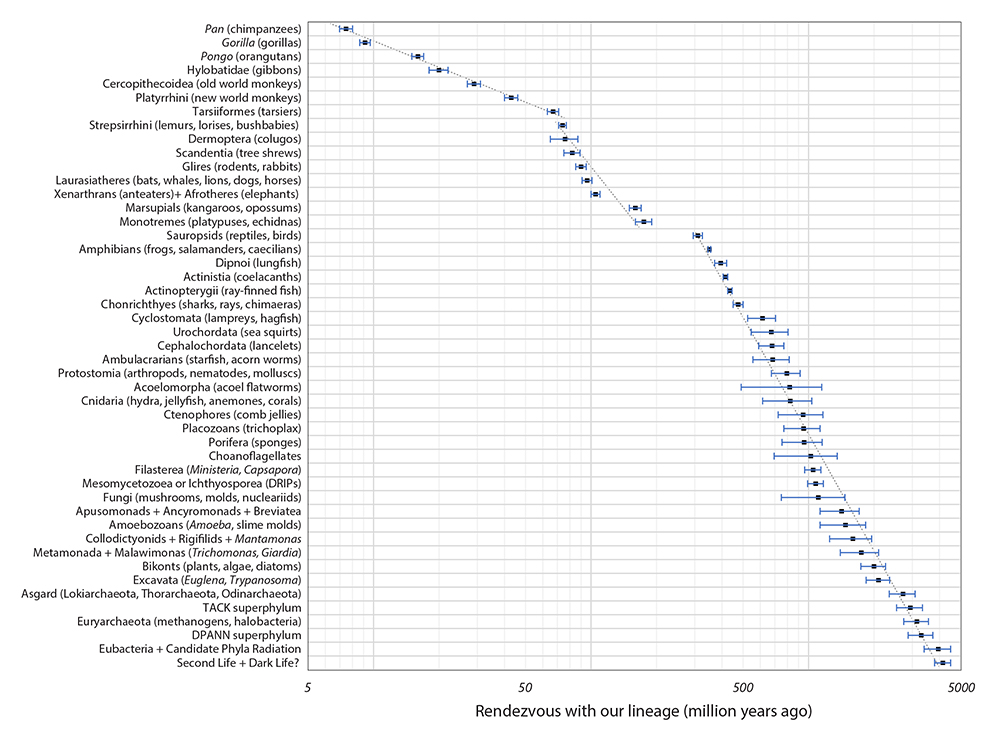 |
| Figure 6. Plot of the dates of the 47 nodes in Table 1. We have superimposed notional lines over three sections of the plot. (Please click here for higher resolution jpg.) |
For some of the less well-understood, recently proposed branches, we have adopted the nomenclature of Cavalier-Smith and co-authors (e.g. Cavalier-Smith et al. 2014, Ruggiero et al. 2015). This was necessary because Dawkins & Wong (2016) gave the name of the new group that was joining our group, but sometimes ignored the name of our group before and after the rendezvous. For a given node N, the uncertainties on its date can sometimes overlap with the dates of nodes N+1 or N-1. The larger this overlap, the more uncertain is the order of the nodes.
Problems with Phylogenetic TreesThe powerful perspective and simplicity of Figure 4 and Table 1 are based on the vertical transmission of the most conserved core genes. Such trees are very useful as a reference for the vertical transmission of genes, but not as a full picture of evolution. More realistic network-like evolution can be informatively compared to this vertical-transmission-only tree (Doolittle & Bapteste 2007, Bapteste et al. 2009).
There are many well-known problems with such “vertical-only”, “divergence-only” approaches to the evolution of life. What happens when two organisms from different parts of the tree merge? Where in the tree does the new chimeric organism belong? Some horizontal convergences have been well-documented as endosymbiotic events. Mitochondria and plastids in eukaryotes have endosymbiotic origins but many other organelles could have such endosymbiotic origins (Sagan 1967, Margulis et al. 2000, 2006). Deeper in the tree and even more prevalent is the horizontal gene transfer (HGT) between bacteria and archaea. A vertical-transmission-only tree should be based on genes that have not been horizontally transferred, but as we explore deeper and earlier in evolution, such non-HGT genes become rarer. Another problem is the discrete nature of the branches. The sexual isolation of most eukaryotic species is legitimately represented by discrete branches, but bacteria exchange genes with other bacteria, near and far – indiscriminately and promiscuously. This HGT undermines the genetic isolation of bacterial and archaeal “species” (Doolittle & Papke 2006).
Linnaeus, Darwin and modern biology have gradually shown us our place in nature. We know our position among the apes and primates and vertebrates and eukaryotes – but the deeper we go into the tree of life, the more uncertain the nodes of the phylogenetic tree become. As sexual species, it made sense to pretend that all life forms are sexually isolated and therefore uniquely identified as a lineage or a branch on the tree of life.
The branches of almost all sexual species diverge nicely like the branches of a real tree. But the tree of all life, especially as we get closer to the root, is not so simple. The earliest branches are vague. Without sex, bacterial species are not isolated and so aren’t branches (Doolittle & Papke 2006). They are networks of molecules and genes and endosymbiotic unions – perhaps as many convergences as divergences. There are groupings on many scales. Overlay a few thousand gene-trees and an average species-tree will emerge, but the prevalence of endosymbiotic events during the origin of the eukaryotic cell, and the increasing prevalence of HGT as we go deeper into the prokaryotic tree produces a complex network of divergences and convergences that we are still trying to unravel.
As more genomes are sequenced, the resulting phylogenetic trees reveal more about who we are and our humble sliver of genetic space. These sequences have also become the most fertile sources of information about the Last Universal Common Ancestor (LUCA) and the origin of life on Earth.
SummaryJust as the Apollo and Voyager missions showed us spaceship Earth as a pale blue dot (the spatial overview effect), we propose a biological overview effect produced by looking at the tiny twig of humanity on the phylogenetic tree of life. Modern genome sequencing shows us our humble, pale green eukaryotic island among the ocean of genetic diversity of life on Earth. Based on increasingly precise phylogenetic trees and molecular clocks, we compile and present the most concise taxonomic overview of our lineage as we evolved over the past ~4 billion years, from Archaea into humans. This biological overview can help us understand and navigate the integrated history of life and humanity.
ReferencesAdams, F. & Laughlin, G. 1997. “A Dying Universe: the long term fate and evolution of astrophysical objects.” Rev. Mod. Phys., 69, 337.
Adams, F. & Laughlin, G. 1999. Five Ages of the Universe: inside the physics of eternity. Free Press Publishers.
Bapteste, E. et al. 2009. “Prokaryotic evolution and the tree of life are two different things.” Biology Direct, 2009, 4, 34.
Betts et al. 2018. “Integrated genomic and fossil evidence illuminates life’s early evolution and eukaryote origin.” Nature Ecology & Evolution, 2, 1556-1562.
Brand, S. 1968. Whole Earth Catalog, Whole Earth Publishing.
Cavalier-Smith, T. Ema E. Chao, Elizabeth A. Snell, Cédric Berney, Anna Maria Fiore-Donno, Rhodri Lewis 2014. “Multigene eukaryote phylogeny reveals the likely protozoan ancestors of opisthokonts (animals, fungi, choanozoans) and Amoebozoa.” Molecular Phylogenetics and Evolution, 81, 71-85.
Christian, D. 2004. Maps of Time: an introduction to big history. Berkeley: Univ. California Press.
Christian, D. 2018. Origin Story, New York: Little, Brown and Company.
Dawkins, R. & Wong, Y. 2016. The Ancestor’s Tale: A Pilgrimage to the Dawn of Evolution. Mariner.
Dodd, M.S. et al. 2017. “Evidence for early life in Earth’s oldest hydrothermal vent precipitates.” Nature, 543, 7643, 60-64.
Domazet-Lošo T. & Tautz D. 2010. “Phylostratigraphic tracking of cancer genes suggests a link to the emergence of multicellularity in metazoa.” BMC Biol 8, 66.
Doolittle, W.F. & Papke, R.T. 2006. “Genomics and the bacterial species problem”, Genome Biol., 7, 9, 116.
Doolittle, W.F. & Bapteste, E. 2007. “Pattern pluralism and the Tree of Life hypothesis.” PNAS, 104, 7, 2043-2049.
Fournier, G.P. Huang, J. & Gogarten, J.P. 2009. “Horizontal gene transfer from extinct and extant lineages: biological innovation and the coral of life.” Phil. Trans. Roy. Soc. B, 364, 1527.
Hug, L. et al. 2016. “A new view of the tree of life.” Nature Microbiology, 1, 16048.
Kolb, R. 2006. “A Recipe for Primordial Soup, in Cosmic Questions”, Annals of the N.Y. Acad. Sciences, 950, 1, 54-65.
Kuhn, T. 1962. The Structure of Scientific Revolutions. Chicago: University of Chicago Press.
Kumar S., Stecher G., Suleski M., Hedges S.B. 2017. “TimeTree: A Resource for Timelines, Timetrees, and Divergence Times.” Mol Biol Evol 34, 7, 1812-1819.
Lineweaver, C.H. & Egan, C. 2007, “The Cosmic Coincidence as a Temporal Selection Effect Produced by the Age Distribution of Terrestrial Planets in the Universe” Astrophysical Journal, 671, 853.
Margulis, L. Dolan, M.F. & Guerrero, R. 2000. “The chimeric eukaryote: Origin of the nucleus from the karyomastigont in amitochondriate protists.” PNAS, 97, 13, 6954–6959.
Margulis, L. et al. 2006. “The last eukaryotic common ancestor (LECA): Acquisition of cytoskeletal motility from aerotolerant spirochetes in the Proterozoic Eon.” PNAS, 103, 35, 13080–13085.
Nutman, A.P, Bennett, V.C., Friend, C.R.L., Van Kranendonk, M.J. & Chivas, A.R. 2016. “Rapid emergence of life shown by discovery of 3,700-million-year-old microbial structures.” Nature, 537, 535-538.
Oesch, P.A. et al. 2018. “HDUV: The Hubble Deep UV Legacy Survey.” Astrophys. Jour. Supp. Ser., 237, 1.
O’Neill, I. 2008. “The Human Brain in Space: Euphoria and the “Overview Effect” Experienced by Astronauts”, Universe Today, 2008-05-22, www.universetoday.com/14455/the-human-brain-in-space-euphoria-and-the-overview-effect-experienced-by-astronauts/ (Accessed 27/03/2019).
Planetary Society. 2019. “A Pale Blue Dot”, http://www.planetary.org/explore/space-topics/earth/pale-blue-dot.html (Accessed 27/03/2019).
Rodrigue, B., Grinin, L. & Korotayev, A. 2017. From Big Bang to Galactic Civilization: A Big History Anthology, Primus.
Ruggiero, M.A., Gordon, D.P., Orrell, T.M. Bailly, N. Bourgoin, T. Brusca, R.C. Cavalier-Smith, T. Buiry, M.D. & Kirk, P.M. 2015. “A Higher Level Classification of All Living Organisms” PLoS ONE 10(4):e0119248.
Sagan, C. 1994. Pale Blue Dot: A Vision of the Human Future in Space, Ballantine Books.
Sagan, L. 1967. “On the Origin of Mitosing Cells.” J. Theor. Biol., 14, 225-274.
Shalchian-Tabrizi K, Minge MA, Espelund M, Orr R, Ruden T, Jakobsen KS, et al. 2008. “Multigene Phylogeny of Choanozoa and the Origin of Animals.” PLoS ONE 3(5): e2098.
Stevenson, D.J. & Halliday, A.N. 2014. “Origin of the Moon: challenges and prospects.” Phil. Trans. Roy. Soc. A, 372, 2024.
Trigos, A. et al. 2017. “Altered interactions between unicellular and multicellular genes drive hallmarks of transformation in a diverse range of solid tumors.” PNAS 114, 24, 6406-6411.
Weiss, M.C. et al. 2016. “The physiology and habitat of the last universal common ancestor.” Nature Microbiology, 16116.
White, F. 2014. The Overview Effect: Space Exploration and Human Evolution. American Institute of Aeronautics and Astronautics, Reston.
White, F. 2019. The Cosma Hypothesis, Morgan Brook Media.
Wolpert, L. 1991. The triumph of the embryo. Oxford [England]: Oxford University Press, p 12.